¶ 4. REPORTS
¶ 4.1 BUILD A REPORT
To build a report, click on 'My Reports' then on 'Create a new report'.
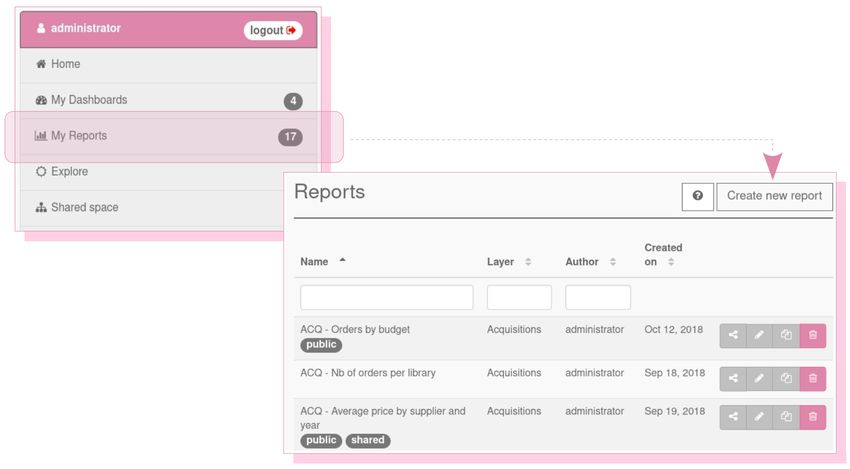
The report builder is displayed and you can build your report in a few clicks.
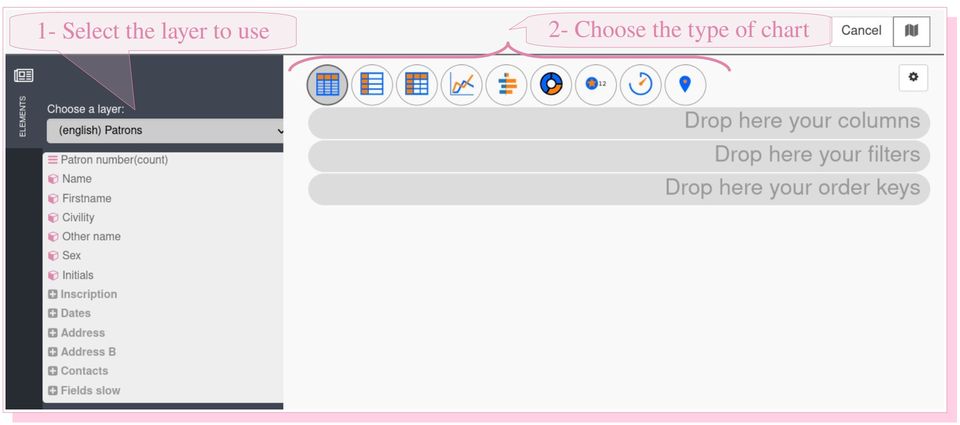
The areas to drag into depend on the type of report you want to make.
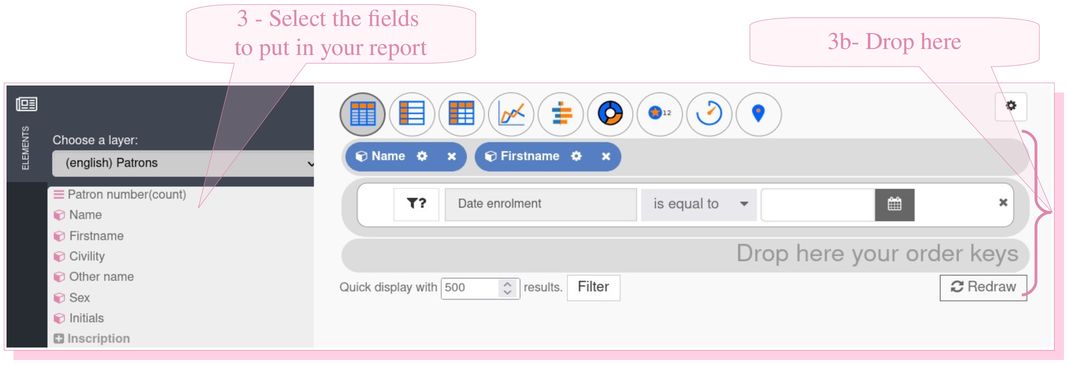
Example: list the first and last names of members according to their registration date
¶ 4.2 USING A FILTER
Filters allow you to limit the data on which your reports are built. A filter can be fixed, chosen by the report creator or selected by the user when running the report.
By default filters are fixed.
When you drag a field into this space, a filter definition form appears. It allows you to define the criteria to be systematically applied to your report, or to activate the filter at runtime. If you enable this option, the end user will be able to/should set the filter at runtime.
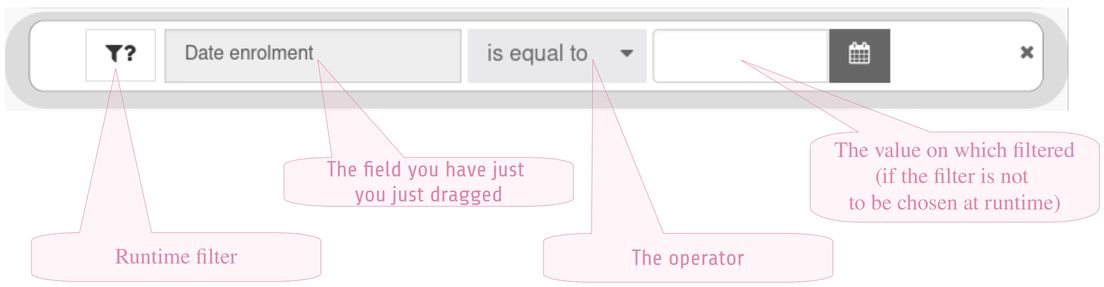
Clicking on the first button (funnel shaped) allows you to activate a filter at runtime.
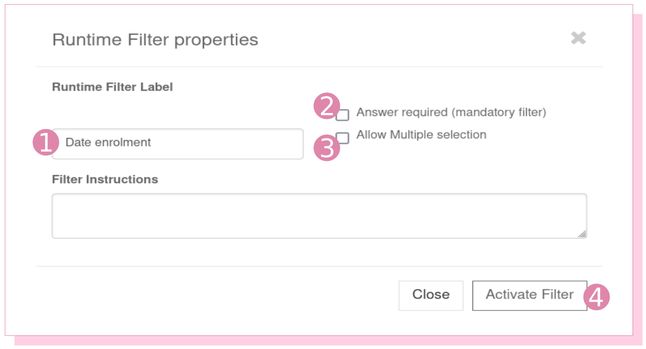
- If you want this filter to be activated each time the report is launched, you have to put a label on the filter ➊.
- If you want a value to be entered at the filter level then check the 'Answer required' box ➋.
- If you want to be able to query multiple values for the same filter then check the 'Allow multiple selection' box ➌.
- Click on 'Activate filter' to have the filter presented to the user when running the report ➍.
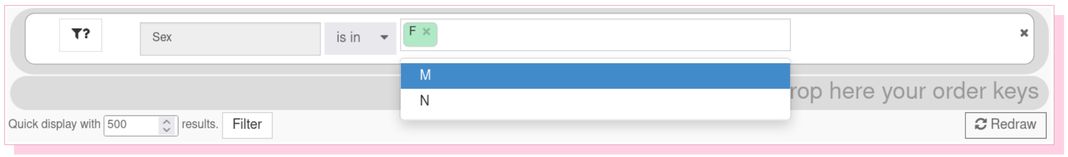
If you want to put multiple values for the same filter then the operator to choose will be 'is in'.
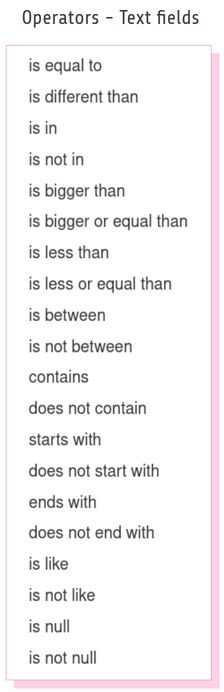
The list of operators proposed depends on the type of field selected (text, date, etc.).
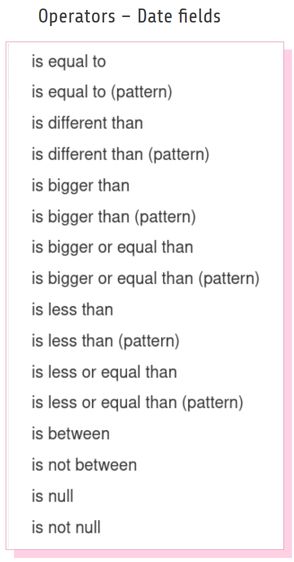
The ‘pattern’ options allow to select values related to the current date (‘today’, ‘this week’, ‘last year’, etc.).
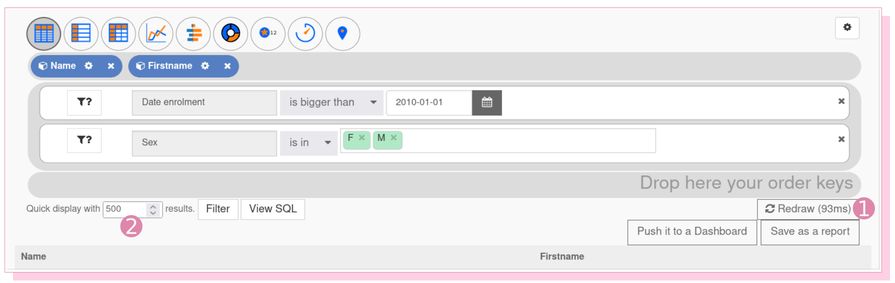
¶ 4.3 REDRAW
The 'Redraw' button ➊ allows to launch the report and test it on a sample of 500 data by default ➋.
It is possible to enlarge this sample by replacing 500 by the number of your choice.
¶ 4.4 TYPE OF THE REPORT: TABLE OR CHART
From this series of pictograms you can choose the presentation of the results.
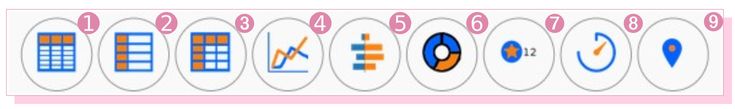
- ➊ Data sorted in columns (table)
- ➋ Data sorted in rows (table)
- ➌ Data classified in a pivot table; this is the equivalent of the pivot table in Excel or the dynamic table in LibreOffice Calc
- ➍ Data presented in a graph with curves
- ➎
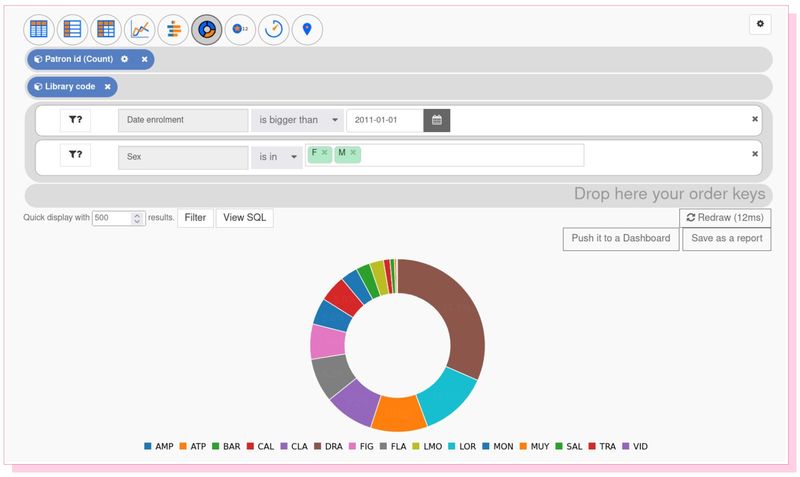
- ➏ Data presented in a pie chart
- ➐ Returns a single value. Useful in a dashboard
- ➑ Gauge
- ➒
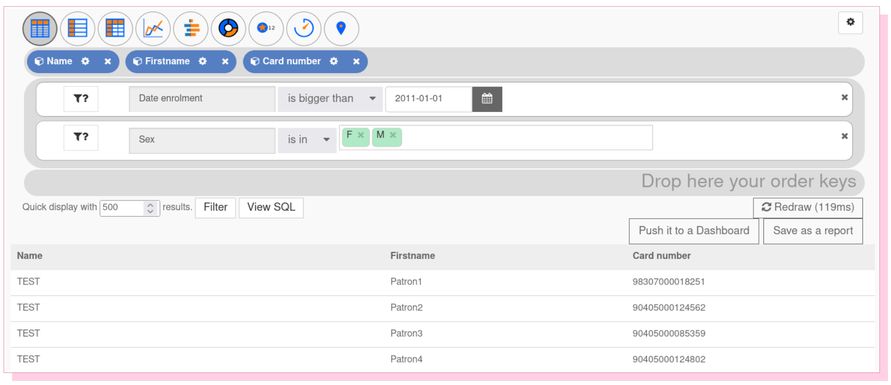
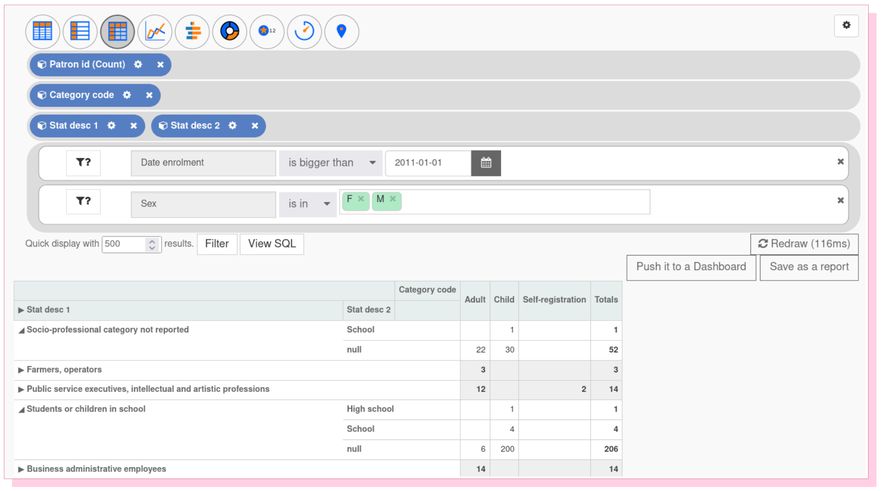
¶ 4.4.1 Report in columns
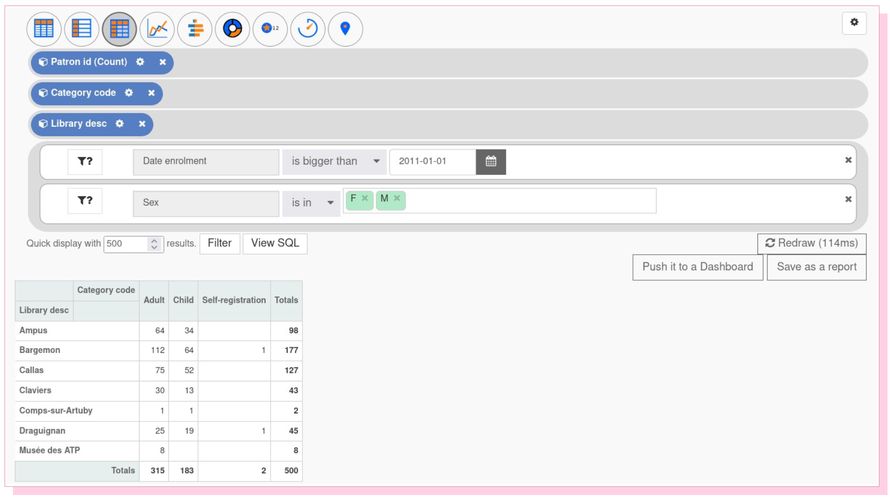
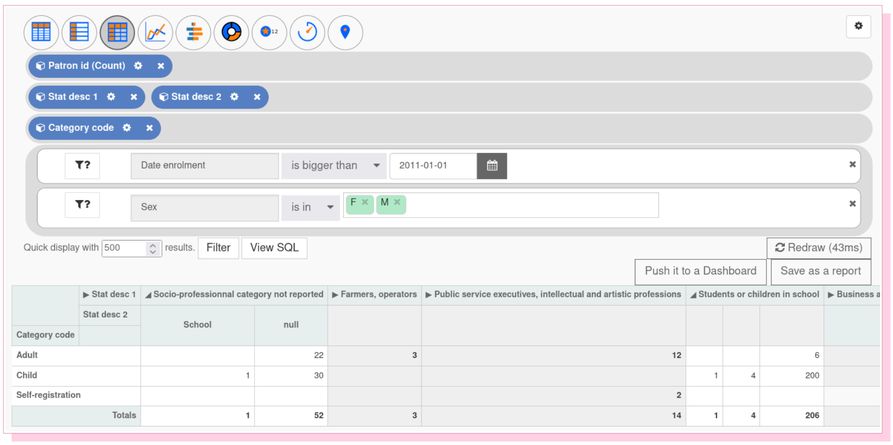
¶ 4.4.2 Pivot table
¶ 4.4.3 Chart
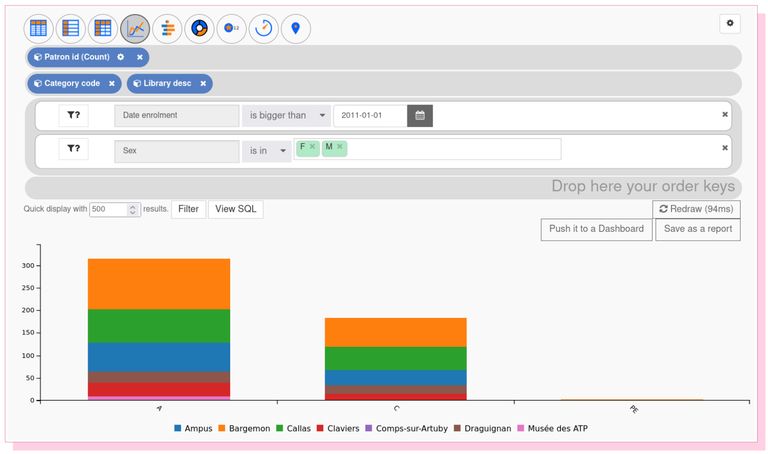
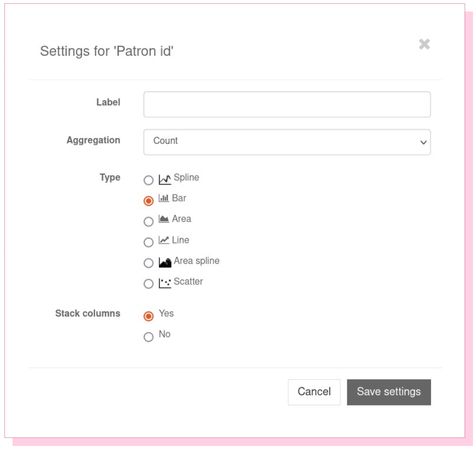
The different types of charts
Urungi offers the following chart types, accessible by clicking on the wheel of the metric field.
¶ 4.4.4 Diagramme
¶ 4.4.5 Single value and Gauge
These two report types return a single value and a gauge. They are only relevant when building a dashboard, to present different values with their context.
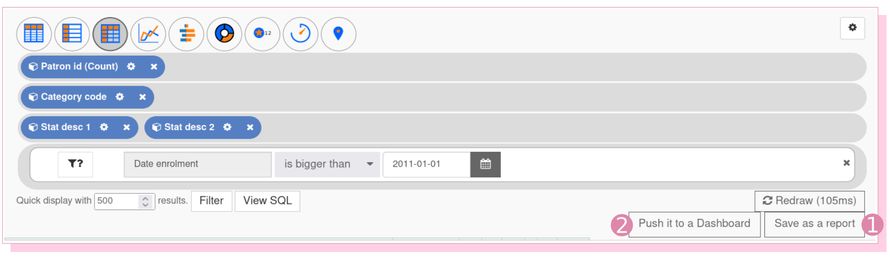
¶ 4.5 SAVE A REPORT
At the end of the report construction, you have the choice between 'Save as report' ➊ or 'Push it to a dashboard' ➋.
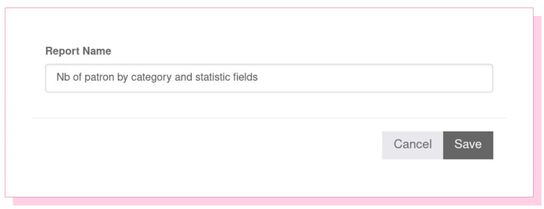
¶ 4.5.1 Save as a report
The 'Save as a report' option will save the report in the 'My reports' section.
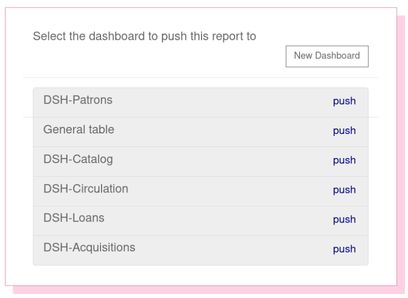
¶ 4.5.2 Add to a dashboard
After clicking on 'Push it in a Dashboard', you have the choice of sending the report to an existing dashboard or creating a new one.
The report added to the dashboard is located after the other reports already added ➊. All that remains to be done is to modify its title ➋ and then insert it in a dashboard box ➌.
If you want to remove a report from the dashboard, just use the pictogram (bin).
Warning: the modification of a report in a dashboard will not have any impact on an equivalent report located in 'My reports', the report is duplicated in the dashboard.
¶ 4.6 SHARE A REPORT
Then, it is possible to share your report via the pictogram (share-icon).
When sharing, 2 choices are possible:
- give access to the report via a public url ➊
- insert the report in the Urungi shared space ➋.
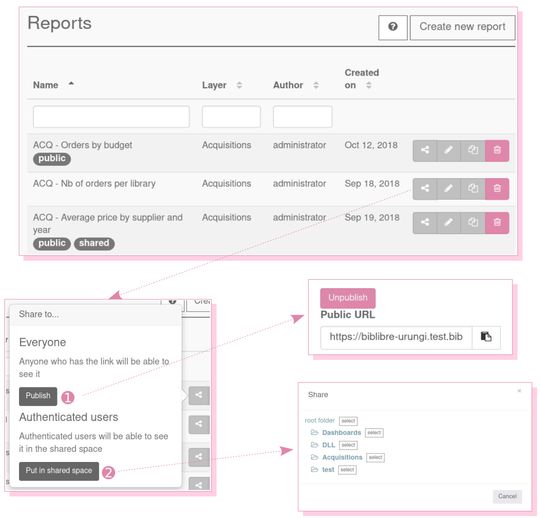
After sharing or publishing, a 'Shared' and/or 'Public' mention is displayed below the report title.

It is possible to undo the publication and/or sharing at any time by clicking again on the pictogram (share-icon).
Warning: Reports saved in the 'My reports' section are not synchronized with reports saved/imported in the dashboards. A report saved outside a dashboard will always remain as a report not linked to a dashboard. Subsequent import of the report into a dashboard will be a duplication of the report. So you can end up with two identical reports: one in the 'My reports' section and one in a dashboard.